介绍了一些简单的绘图函数,需要更难的操作还需要去查文档
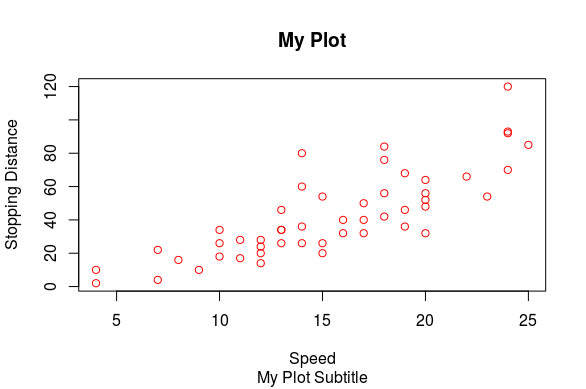
> data(cars) #load data
> head(cars)
speed dist
1 4 2
2 4 10
3 7 4
4 7 22
5 8 16
6 9 10
> plot(x = cars$speed, y = cars$dist, ylab = "Stopping Distance", xlab = "Speed", main = "My Plot", sub = "My Plot Subtitle", , col = 2) # 图1
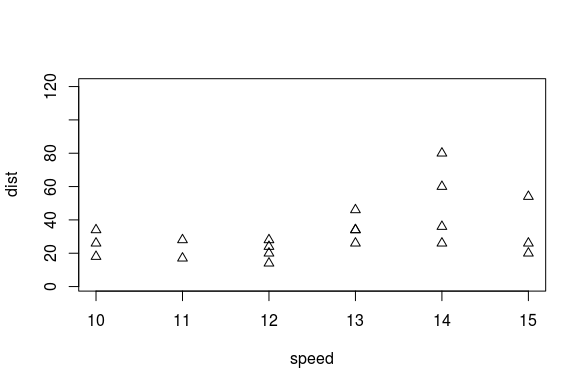
> plot(cars, xlim = c(10, 15), pch = 2) # 图2
> data(mtcars)
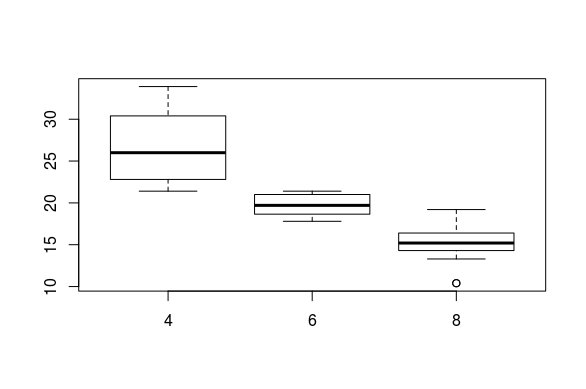
> boxplot(formula = mpg ~ cyl, data = mtcars) # 图3
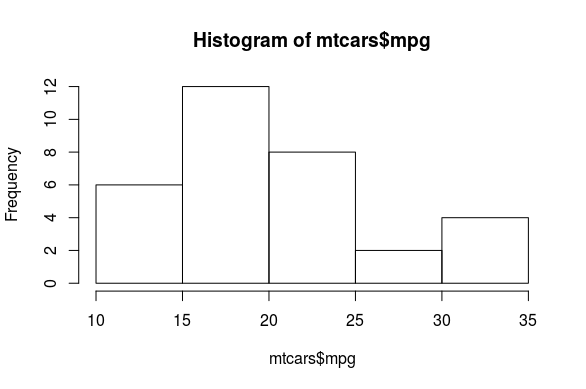
> hist(mtcars$mpg) # 图4